Fourth Week Report
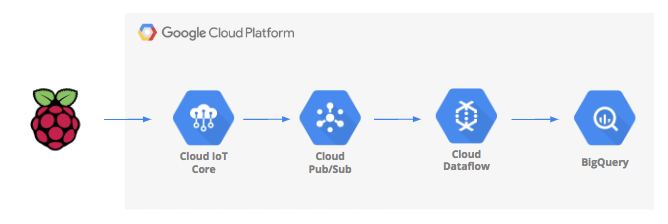
Building and Running a complete data pipeline
It starts with an internet of things (IoT) device which captures temperature, leaverages IoT Core to securely publish the data to a message queue where it will then be transported into a data warehouse.
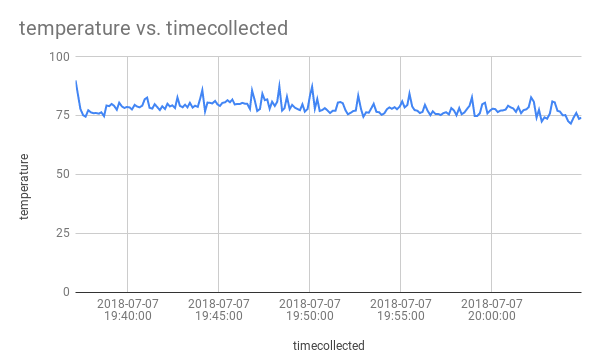
At the end of this blog we will be able to visualise our data using bigquery and charts in google sheets as shown in the following picture:
Setting up the GCP and Enabling the APIs
- Sign-in to Google Cloud Platform console
- We can use any existing project or create a new project
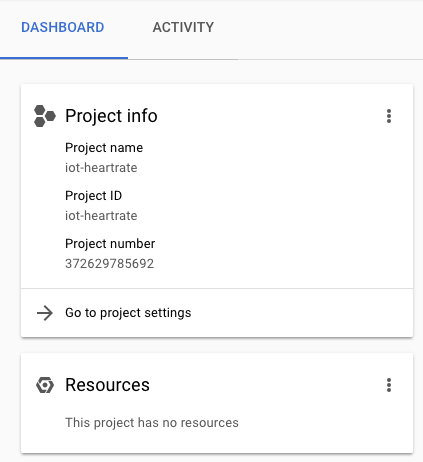
- While creating the new project, we should make sure that the project ID should be a unique name accross all Google Cloud projects.
- Refer to the following picture for a quick reference:
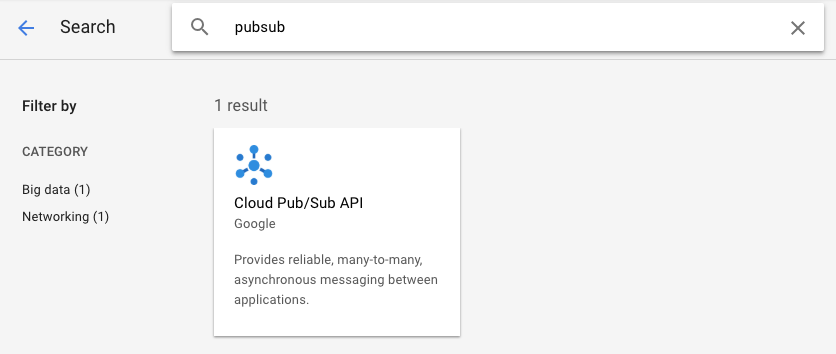
In this codelab we will be using Pub/Sub, Dataflow, Compute Engine and IoT Core, so we’ll need to enable those APIs.
Select APIs from the Cloud Console menu.
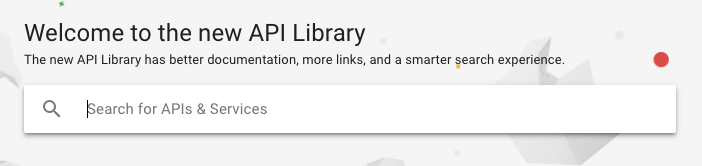
Enable the required APIs i.e. Dataflow, Compute Engine and IoT Core using the similar procedure as done here for Pub/Sub API below.
Creating a BigQuery table
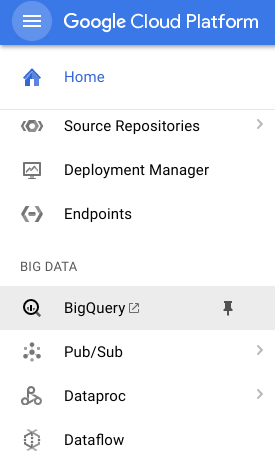
Bigquery is serverless, highly scalable, low cost enterprise data warehouse that will be an ideal option to store data being streamed from IoT devices.
Let’s create a table that will hold all of the IoT temperature data. Open Bigquery using the cloud console.
Create a table using bigquery as shown below.
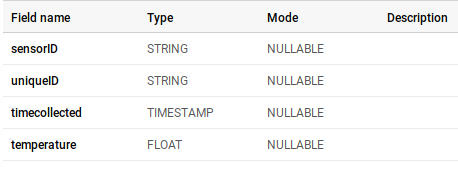
Now we have a warehouse setup to receive our temperature data.
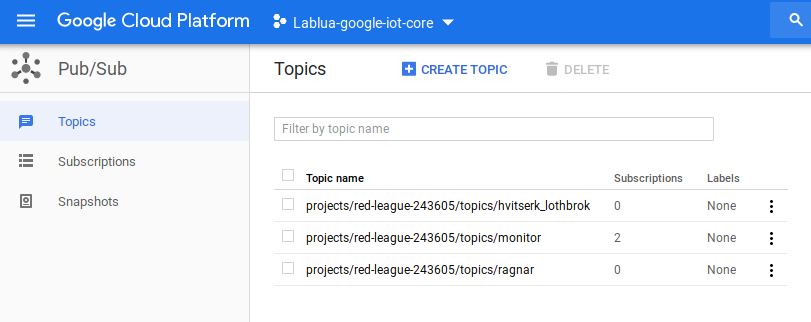
Create a Pub/Sub topic and subscription
Cloud Pub/Sub is a simple, reliable, scalable foundation for streaming data and event-driven computing systems. As a result, it is perfect for handling incoming IoT messages and then allowing downstream systems to process them which is why it is tightly linked with Cloud IoT Core.
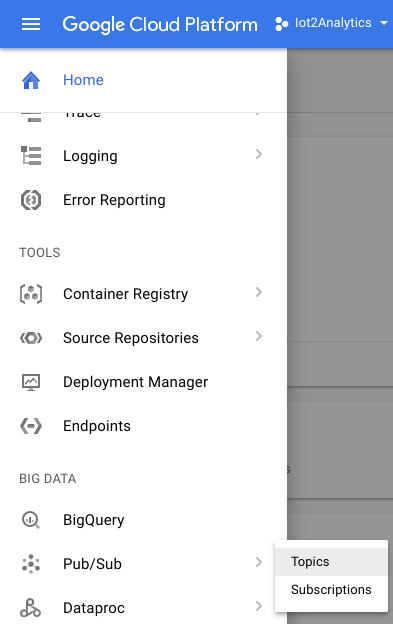
Create a topic and make a subscription to it.
Use a Dataflow Template
Cloud computing has made possible fully managed models of computing where logic can be created easily. For this lab, a Dataflow template will be used to create a process that monitors a Pub/Sub topic for incoming messages and then moves them to BigQuery.
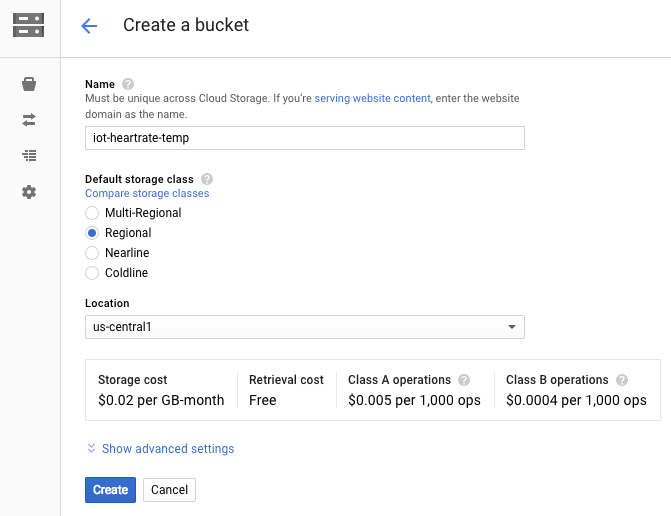
Dataflow will need a location to store temporary files, so we will provide a location in Google Cloud Storage. From the Cloud Console, select Storage and then Browser.
For this temporary storage, we need to create a storage bucket.
Now let’s move on to Cloud Dataflow.
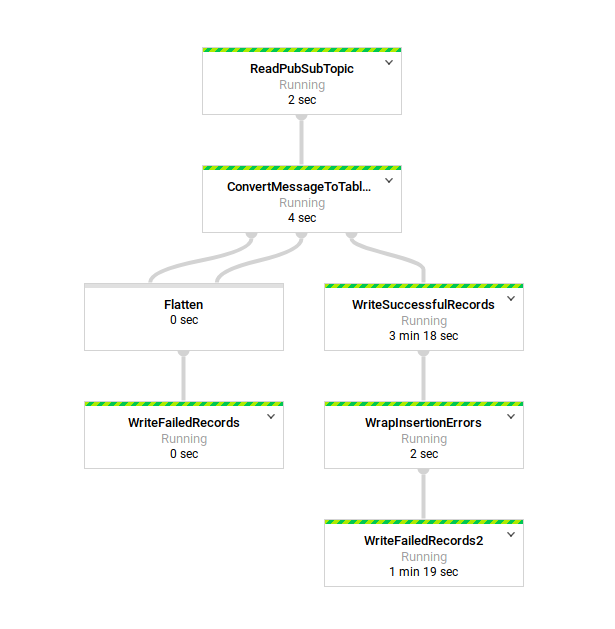
Click on Create Job from Template. Give the job a name and select the PubSub to BigQuery template. Make sure the Regional endpoint matches where the rest of your project resources are located. Fill in the remainder of the field making sure that they align with the name of your storage bucket, Pub/Sub topic and BigQuery dataset and tablename. Click on Run Job.
And Hence our Dataflow job is started.
Create an IoT Registry
Now, create an IoT Registry to access and create a virtual version of all your devices.
Cloud IoT Core is a fully managed service that allows you to easily and securely connect, manage, and ingest data from millions of globally dispersed devices. Cloud IoT Core is the central service that, when combined with other services on Google Cloud IoT platform, provides a complete solution for collecting, processing, analyzing, and visualizing IoT data in real time.
You can follow up the previous blogs on how to create a IoT Core Device Registry using Google cloud console.
Don’t forget to add devices to your IoT Core registry.
Simulated data streaming
Since, we don’t have a built in IoT temperature sensor with raspberry pi, we can simulate data by using a sample dataset, reading it with a python script on a VM in Compute Engine and feeding it into IoT Core.
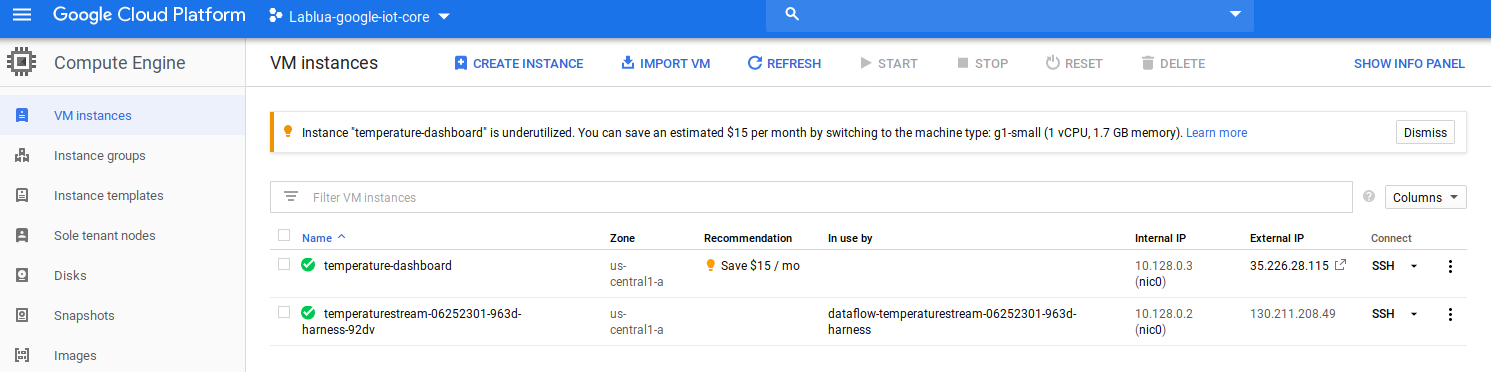
Create new VM instance with default options after selecting Compute engine in google cloud console.
Now, click on the ssh link to connect to the terminal of the virtual machine.
After you have opened the ssh terminal of the Virtual Machine, follow these steps:
-
Install the necessary software
$ sudo apt-get update $ sudo apt-get install git -
Clone the project code
$ git clone https://github.com/googlecodelabs/iotcore-heartrate $ cd iotcore-heartrate -
Make sure the required core packages are installed
$ chmod +x initialsoftware.sh $ ./initialsoftware.sh -
Create a security certificate
  $ chmod +x generate_keys.sh
  $ ./generate_keys.sh
Now you are ready to recieve data from the simulation script in VM.
Run the simulation script:
$ python heartrateSimulator.py --project_id=myproject --registry_id=myregistry --device_id=myVM --private_key_file=../.ssh/ec_private.pem
You might find it a bit difficult dealing with broken pip packages at first but refer to this link to correct those bugs.
You should see the data being sent via MQTT from your VM terminal.
Check the dataflow using the Bigquery table and SQL commands
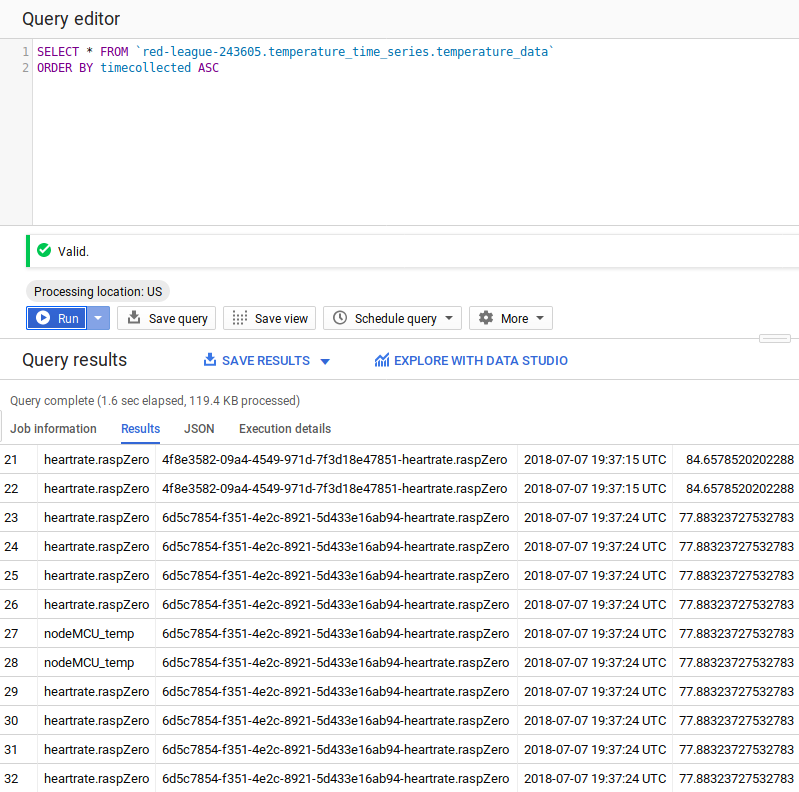
Under the project name (on the left hand side of the window), click on the Dataset (temperatureData), then on the table (temperatureDataTable) and then click on the Query Table button
Add an asterisk to the SQL statement so it reads SELECT * FROM… then add “ORDER BY timecollected ASC” as shown below and then click the RUN QUERY button
After running the query, you’ll notice the following table shows up, ensuring that the data that you sent is being well recieved by the Bigquery and being easily stored.
You can now visualise the data using google sheets funcions or cloud dataflow
Refer to this link for a detailed explanation on how to perform the data visualisation.